Policy Brief
RECEPD No. 2024 – 004
January 2024

This policy brief is a collaborative effort based on data analysis and research discussion among the following researchers affiliated with the Research Consortium on Education Policy and Development in the Greater Bay Area (RECEPD), HKIER:
Dr. Dongshu OU
Dr. Yan CAO
Dr. Kenneth K. WONG
Ms. Maggie FOKThis Policy Brief examines the population trends in nine cities in Guangdong Province, Greater Bay Area (GBA), from 2000 to 2020. This 20-year period provides an opportunity to understand different aspects of population changes in the nine cities before and after the launching of the GBA policy in mid 2010s.
To understand population trends over the 20-year period, this Policy Brief focuses on several variables based on data from population census. The following table identifies the 8 variables used in this city-by-city analysis. In the following sections, we will present our analysis of the 9 GBA cities, namely Dongguan, Foshan, Guangzhou, Huizhou, Jiangmen, Shenzhen, Zhaoqing, Zhongshan and Zhuhai. The analysis also includes a measure “Average GBA,” which provides the average statistics for each variable in the specific time period. In each of the following four sections, we will present our analysis of 2 of the 8 variables on the particular aspects of the population trends over in the 20-year period.
Description of Variables | |
UrbanPop | Proportion of Urban Population to Permanent Population |
PermPop | Permanent Population at Year-end in 10,000 persons |
ImIn | Immigration Within Guangdong |
ImOut | Immigration Outside Guangdong |
EmIn | Emigration Within Guangdong |
EmOut | Emigration Outside Guangdong |
NetIn | Net Migration Within Guangdong |
NetOut | Net Migration Outside Guangdong |
1) Permanent Population and Proportion of Urban Population
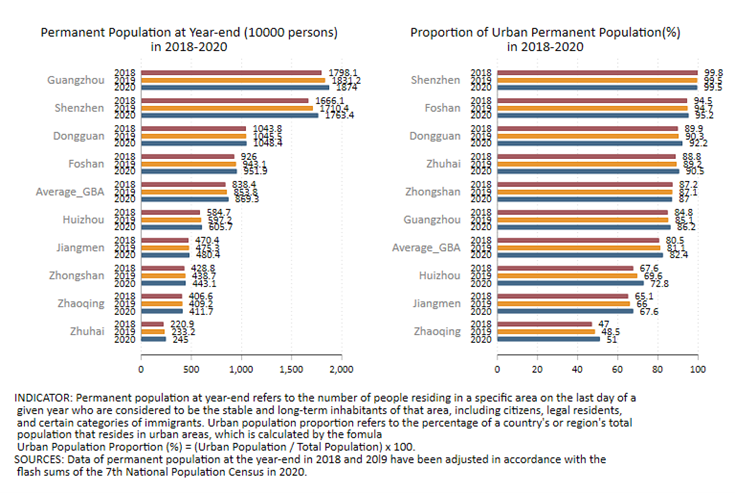
The first graph displays the permanent population and the proportion of urban permanent population in the post-GBA policy years in bar chart, which is from 2018 to 2020. The average in GBA is included for comparison. For permanent population, all 9 cities experience growth in the three-year period. In 2020, the average permanent population in the GBA cities is 8,693,000. Guangzhou has the highest population of 18,740,000 while Zhuhai has the lower population of 2,450,000. Four cities, namely Guangzhou, Shenzhen, Dongguan and Foshan have a permanent population higher than the average in GBA in 2020. Shenzhen has the highest rise in permanent population, from 16,661,000 in 2018 to 17,634,000 in 2020.
In terms of the urban proportion of the permanent population, the average for GBA is 82.4% in 2020. Six of the nine cities, including Shenzhen, Foshan, Zhuhai, Guangzhou, Dongguan and Zhongshan, have the proportion of urban population higher than the GBA average. Although the proportion for Huizhou in 2020 is lower than the GBA average, it experiences the highest rate of increase in the proportion from 67.6% in 2018 to 72.8% in 2020, which is 5.2 percentage points.
Four cities, including Guangzhou, Shenzhen, Dongguan and Zhaoqing, are highlighted to show changes in population over the 20-year period. Guangzhou and Shenzhen ranked above the GBA average, Dongguan is in the middle, and Zhaoqing is at the bottom in terms of the urban proportion of the population. These three city-groups will be referred to as the top-tier, second-tier and third-tier in this Policy Brief.

The permanent populations for all four GBA cities have exhibited an upward trend since 2000. Among these cities, Shenzhen as the top-tier city has experienced the most significant population growth, from 7,012,400 in 2000 to 17,633,800, resulting in a growth of 10,621,400 in 20 years. Whereas for Zhaoqing as a third-tier city, it has the lowest population growth from 3,376,900 in 2000 to 4,116,900 in 2020, which is 740,000 over the same period. The population increase in Shenzhen is approximately 14 times greater than that of Zhaoqing. Concerning the proportion of urban population, both the top- and second-tier cities exhibit a relatively high ratio of urban population. Shenzhen is almost entirely urbanised after 2005 and reached 99.5% of urbanised population in 2020. Guangzhou has experienced a fluctuation of urban population proportion before 2010, but has reached 86.2% in 2020. Dongguan as a second-tier city has experienced a sharp growth in urban population from 60% in 2005 to 88.5% in 2010. This significant shift in the urbanisation rate suggests the transformation of the city’s industrial development. However, it is not the case for Zhaoqing as the third-tier city, as its proportion of urban population is much lower than the GBA average, with only 51.02% in 2020.
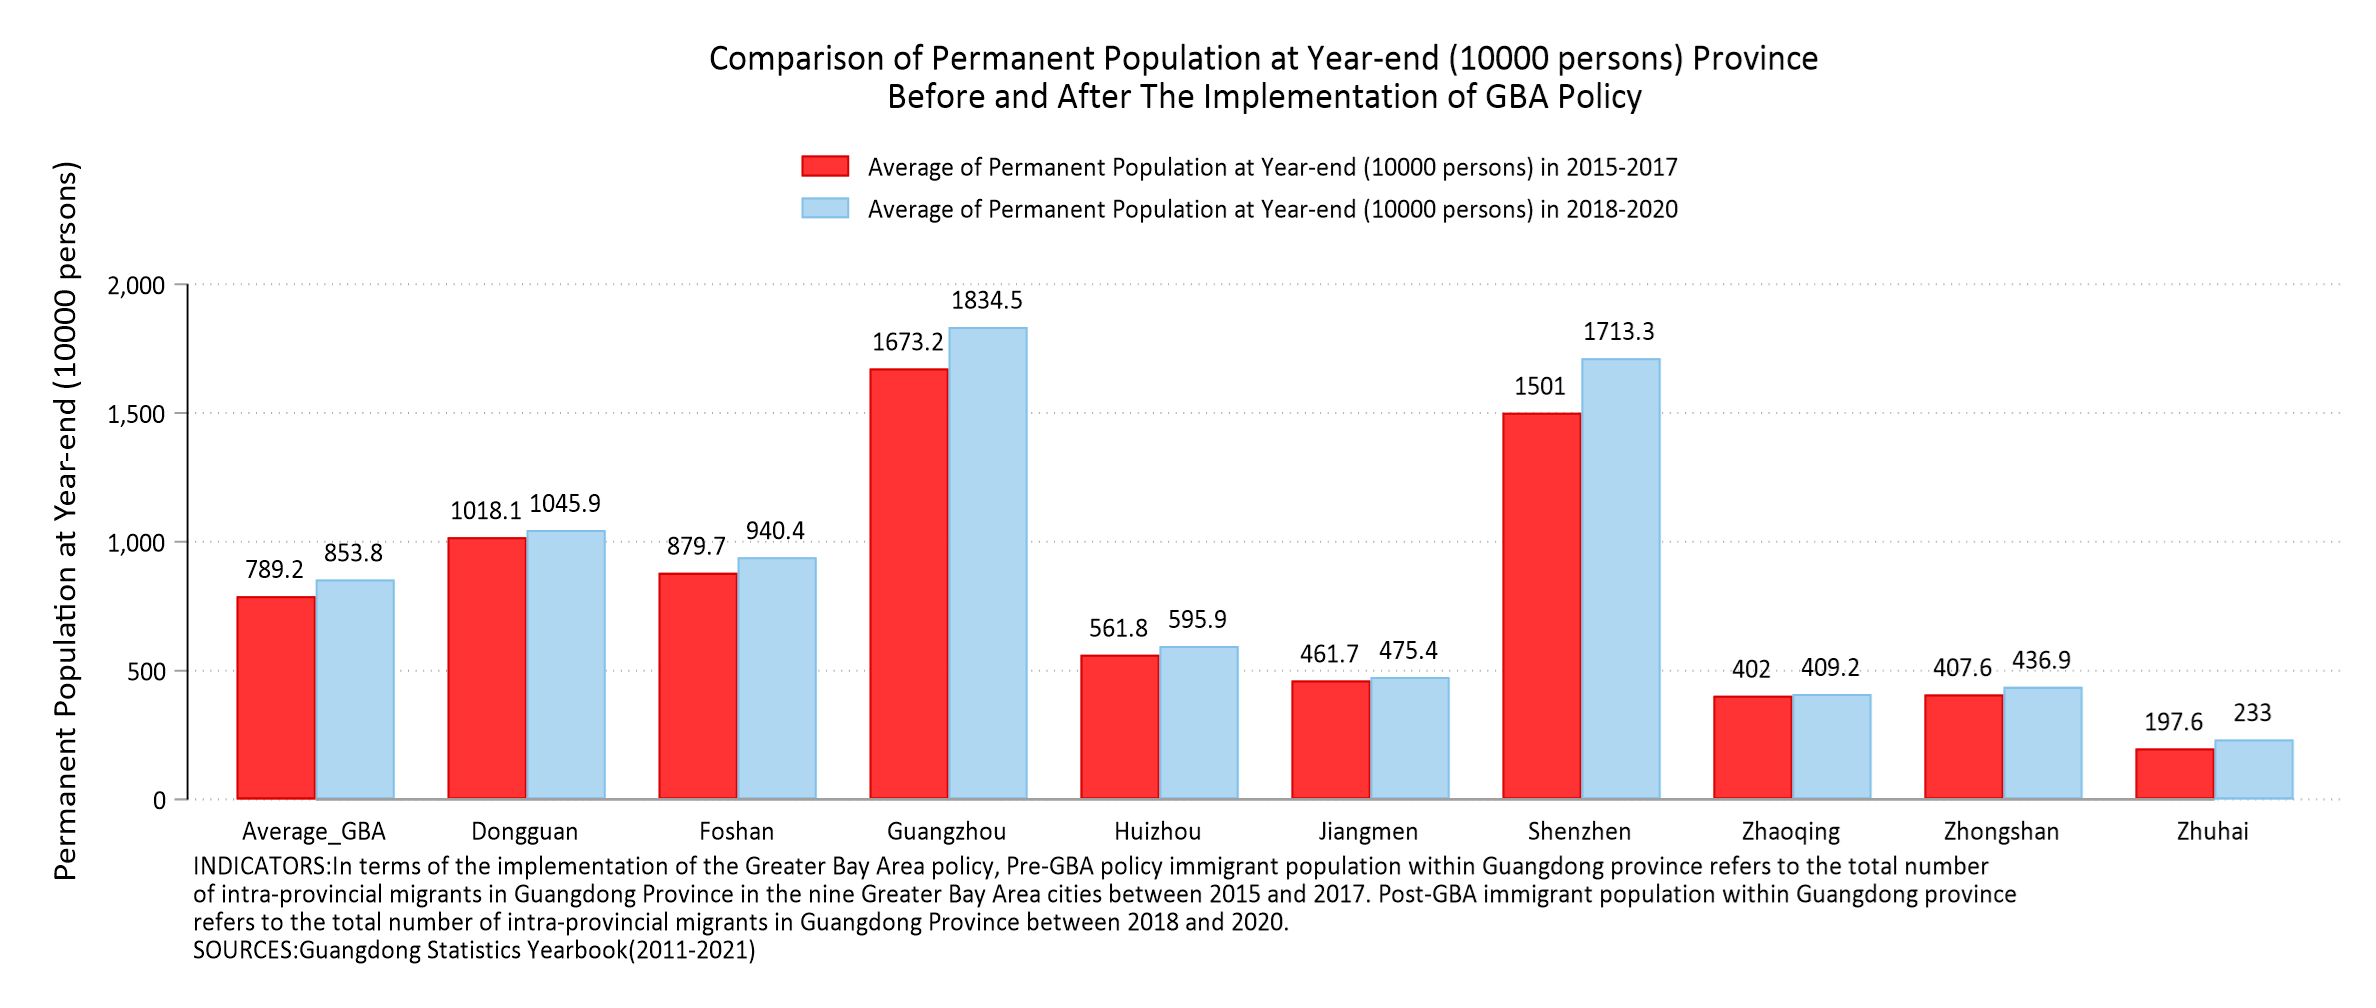
The bar chart on the next page considers 2017 as the reference year, taking into account 3 years of stataistics before (2015-2017) and after (2018-2020) the reference year for comparison. The bars on the far left, which shows the average for the GBA cities, reveals that there is an average increase in the permenant population and the proportion of urban permanent population in the GBA cities.
Guangzhou and Shenzhen are the two top-tier cities with the highest permanent populations during the pre-GBA period. After the launching of the GBA policy, their permanent populations rose from 16,732,000 to 18,345,000 and from 15,010,000 to 17,133,000 respectively. All other cities also experienced a growth in population.
Almost all cities show an increase in urban population proportion except for Shenzhen and Zhongshan. However, the declines are almost negligible (from 99.8% to 99.6% and from 87.3% to 87.1%). Huizhou and Zhaoqing experienced the highest rate of growth in urban population proportion at 5.1% and 4% respectively.

2) Immigration Within and Outside Guangdong
Shenzhen and Guangzhou rank top two cities in terms of immigration within and outside Guangdong province. In 2020, Huizhou ranked third for immigration within Guangdong province with 59,000 persons. A general trend for most of the GBA cities is that the immigration for both within and outside Guangdong province has been declining since 2018. One notable exception is Foshan in 2019, which experienced a boost in immigration with 114,000 persons within and 96,000 persons outside the province.
The average of the immigrant population in the GBA shows an inverted U-shape trend, with the highest point reached in 2018. This pattern is also observed in Shenzhen and Dongguan, where the immigrant population increased from 2016 to 2018 and then declined. However, Guangzhou stands out with a significant increase in immigrant population in 2020, both from within and outside the Guangdong province.
The sudden surge in Shenzhen in 2015 is the steepest, from 74,087 in 2016 to 145,664 in 2018 and from 14,5998 in 2016 to 29,6287 in 2018 for the immigration within and outside Guangdong province respectively. Similar increase is also found from the second-tier city Dongguan, but more moderate and for a short time period. The focused population increased from 16,126 in 2016 to 69,121 in 2018 (from within Guangdong province) and 27,612 in 2016 to 104,541 in 2018 (from outside Guangdong province) respectively. In contrast, Zhaoqing, as a third-tier city, has shown relatively stable changes in its immigrant population, remaining below the GBA average. The number of immigrants to Zhaoqing within Guangdong province has varied between 20,000 and 30,000, while the number from outside Guangdong province has remained below 10,000.

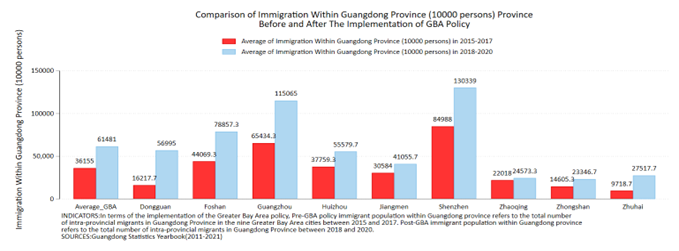
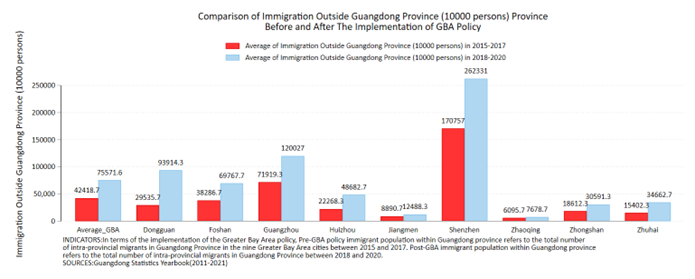
Following implementation of the GBA policy, all cities in the GBA region experienced an increase in immigration population, both from within and outside Guangdong province. Shenzhen and Guangzhou consistently had the highest immigration rates during the period of this analysis, and they also experienced the largest increase in absolute numbers among all nine GBA cities. Further, the population increase for Dongguan and Zhuhai is worthy highlighting. Immigration within Guangdong for Dongguan increases from 16,217 in the pre-GBA years to 56,995 in the post-GBA years, which is around 3.5 times of increase. It is similar for Zhuhai, growing from 9,718 to 27,517, which is around 2.8 times. While Dongguan’s and Zhuhai’s immigration populations still rank behind the top-tier cities like Shenzhen and Guangzhou, their growth in immigration seems significant.
3) Emigration Within and Outside Guangdong
In terms of emigration population, Guangzhou and Shenzhen, as top-tier cities, experience visible increase in emigration outside Guangdong province (26,379 and 20,745 in 2020 respectively). Notwithstanding their highest population emigrating outside the province, they have low population emigration within the province, which constitutes their emigration characteristics. On the contrary, for other cities like Huizhou, Jiangmen and Zhaoqing, people living in those cities are more likely to move within the province rather than outside of Guangdong. To illustrate, Zhaoqing ranks the third for emigration within Guangdong province with 39,000 persons in 2020, but it ranks the seventh for emigration outside Guangdong province with 4,000 persons in 2020 only.
Comparing the average in GBA, there are more people emigrating within Guangdong province than outside the province over the 5-year period. For emigration within the province, Zhaoqing experienced a sudden leap from 28,243 in 2016 to 40,778 in 2017 and then declined since then. These figures are much higher than the average for within-province emigration. However, it is not the case for outside-province emigration as its figure falls below the average, with a continuous drop since 2017 to 4,025 in 2020. The trend for Guangzhou is also worth mentioning, as its emigration population has been declining since 2018, following the launch of the GBA policy. Its emigration population from outside the province dropped from 25,711 in 2018 to 20,745 in 2020.


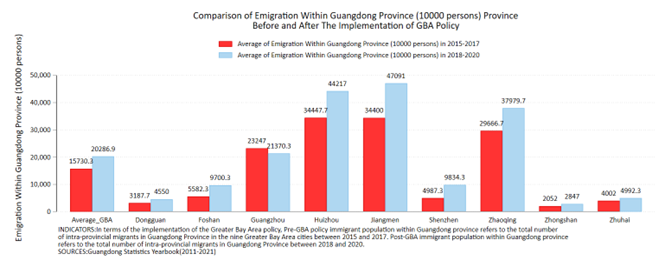

As suggested in the Average GBA bars, the emmigration population increases within Guangdong province from 15,730 in the pre-GBA period to 20,286 in the post-GBA period. Second-tier cities such as Foshan, Huizhou, Jiangmen, Zhongshan and Zhuhai are experiencing an increase in population mobility from within province in the post-GBA period. On the other hand, for most GBA cities in Guangdong, their emigration population outside the provicnce has dropped following the implementation of the GBA policy. Population emmigration outside Guangdong province drops from 10,701 to 9,350 on average. The GBA policy might have increased the economic attractiveness for people to stay in the region.
4) Net Migration Within and Outside Guangdong
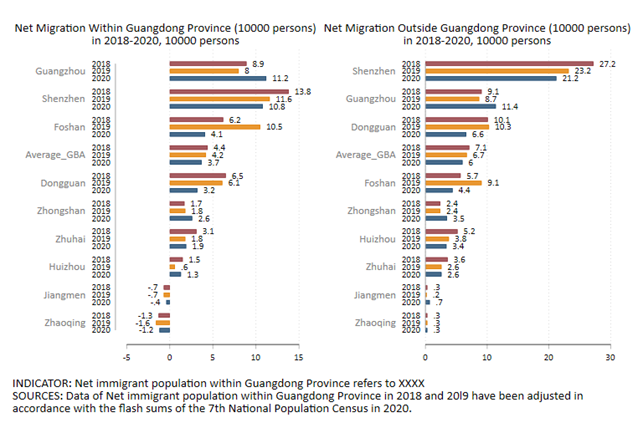
Not surprisingly, Shenzhen and Guangzhou are the most popular cities for Chinese citizens from both within and outside Guangdong province to move into. The net migration within Guangdong province is 107,705 in Shenzhen and 112,134 in Guangzhou in 2020, and the net migration outside Guangdong province is 212,325 in Shenzhen and 113,952 in
Guangzhou in 2020. While most of the GBA cities experience a net increase in their population, Jiangmen and Zhaoqing are the exceptions. They have a negative net migration within Guangdong province throughout 2018-2020 (-3,783 and -11,553 in 2020 respectively), and a slightly positive net migration outside Guangdong province throughout the three years (7,214 and 3,172 respectively). These figures suggest that Jiangmen and Zhaoqing are attractive to citizens outside the GBA (but not as much compared to other GBA cities), but citizens within these two cities might prefer to move to other GBA cities. There is no general trend for the net migration in the 9 GBA cities as they are likely to be differentially affected by the GBA policy. That said, the GBA average shows that the net migration into these cities is declining gradually, be it within or outside the Guangdong province.
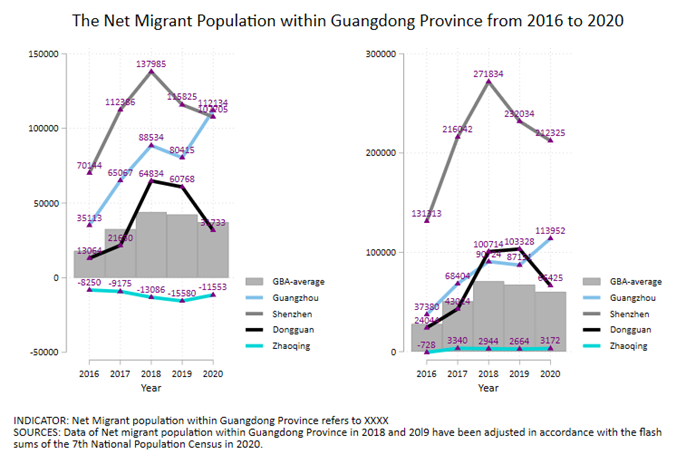
The two graphs above suggests that the net migration trend for both within and outside Guangdong Province is similar. Shenzhen and Dongguan reached their highest net migration at around 2018 and 2019. Guangzhou experienced a rise in net migration in 2019, which is quite unique. For Zhaoqing, its statistics lie below the GBA average and there is not much fluctuation over the years.
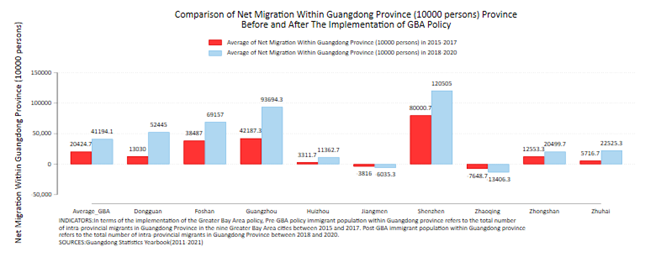
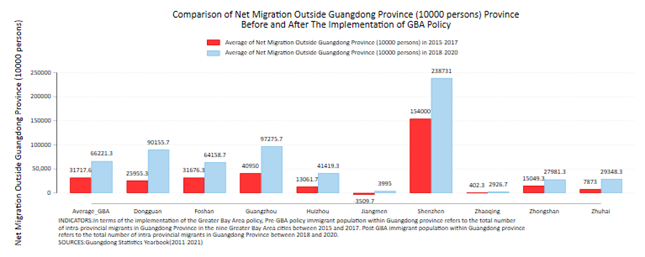
In terms of the GBA average, the doubling of net positive migration (from 20,424 to 41,194 within Guangdong province and from 31,717 to 66,221 outside Guangdong province) may reflect that the GBA policy is effective in attracting Chinese citizens to stay or move into this region. In terms of the net migration both within and outside Guangdong province, Dongguan, Huizhou and Zhuhai are the cities that seem to benefit the most from the GBA policy as their increase in net migration at the post-GBA policy period is around 3 times than before. The GBA policy also favours other GBA cities including Foshan, Guangzhou, Shenzhen and Zhongshan, with the net migration increased by around 2 times for both within and outside Guangdong province. Nonetheless, the situations in Jiangmen and Zhaoqing did not seem to have aided by the GBA policy, as their net migration are virtually zero or even negative. The low net migration could possibly be explained by the emigration statistics, as these two cities are the second and third cities with the highest number of emigrants within Guangdong province.
This policy brief examines several aspects of the population trends in the nine GBA cities in Guangdong province during 2000 and 2020. The top-tier cities, Guangzhou and Shenzhen, stand out with the highest levels of population mobility, as reflected in significant immigration and emigration statistics. In contrast, the second-tier city of Dongguan aligns closely with the GBA average across various variables. The third-tier city, Zhaoqing, lags behind in all statistics, particularly in net migration within Guangdong Province, where it experiences negative migration. Overall, the implementation of the GBA policy since the mid 2010s seems to have likely facilitated talent mobility, but its benefits are mainly observed in the top- and second-tier cities. The challenge lies in supporting the third-tier cities to level up and to continue to grow their urbanized populations.
Room 204, Ho Tim Building, The Chinese University of Hong Kong, Shatin, N.T. Hong Kong
(852) 2603 6850
©2023 ReCEPD, CUHK. All rights reserved. Powered by Techcomm.